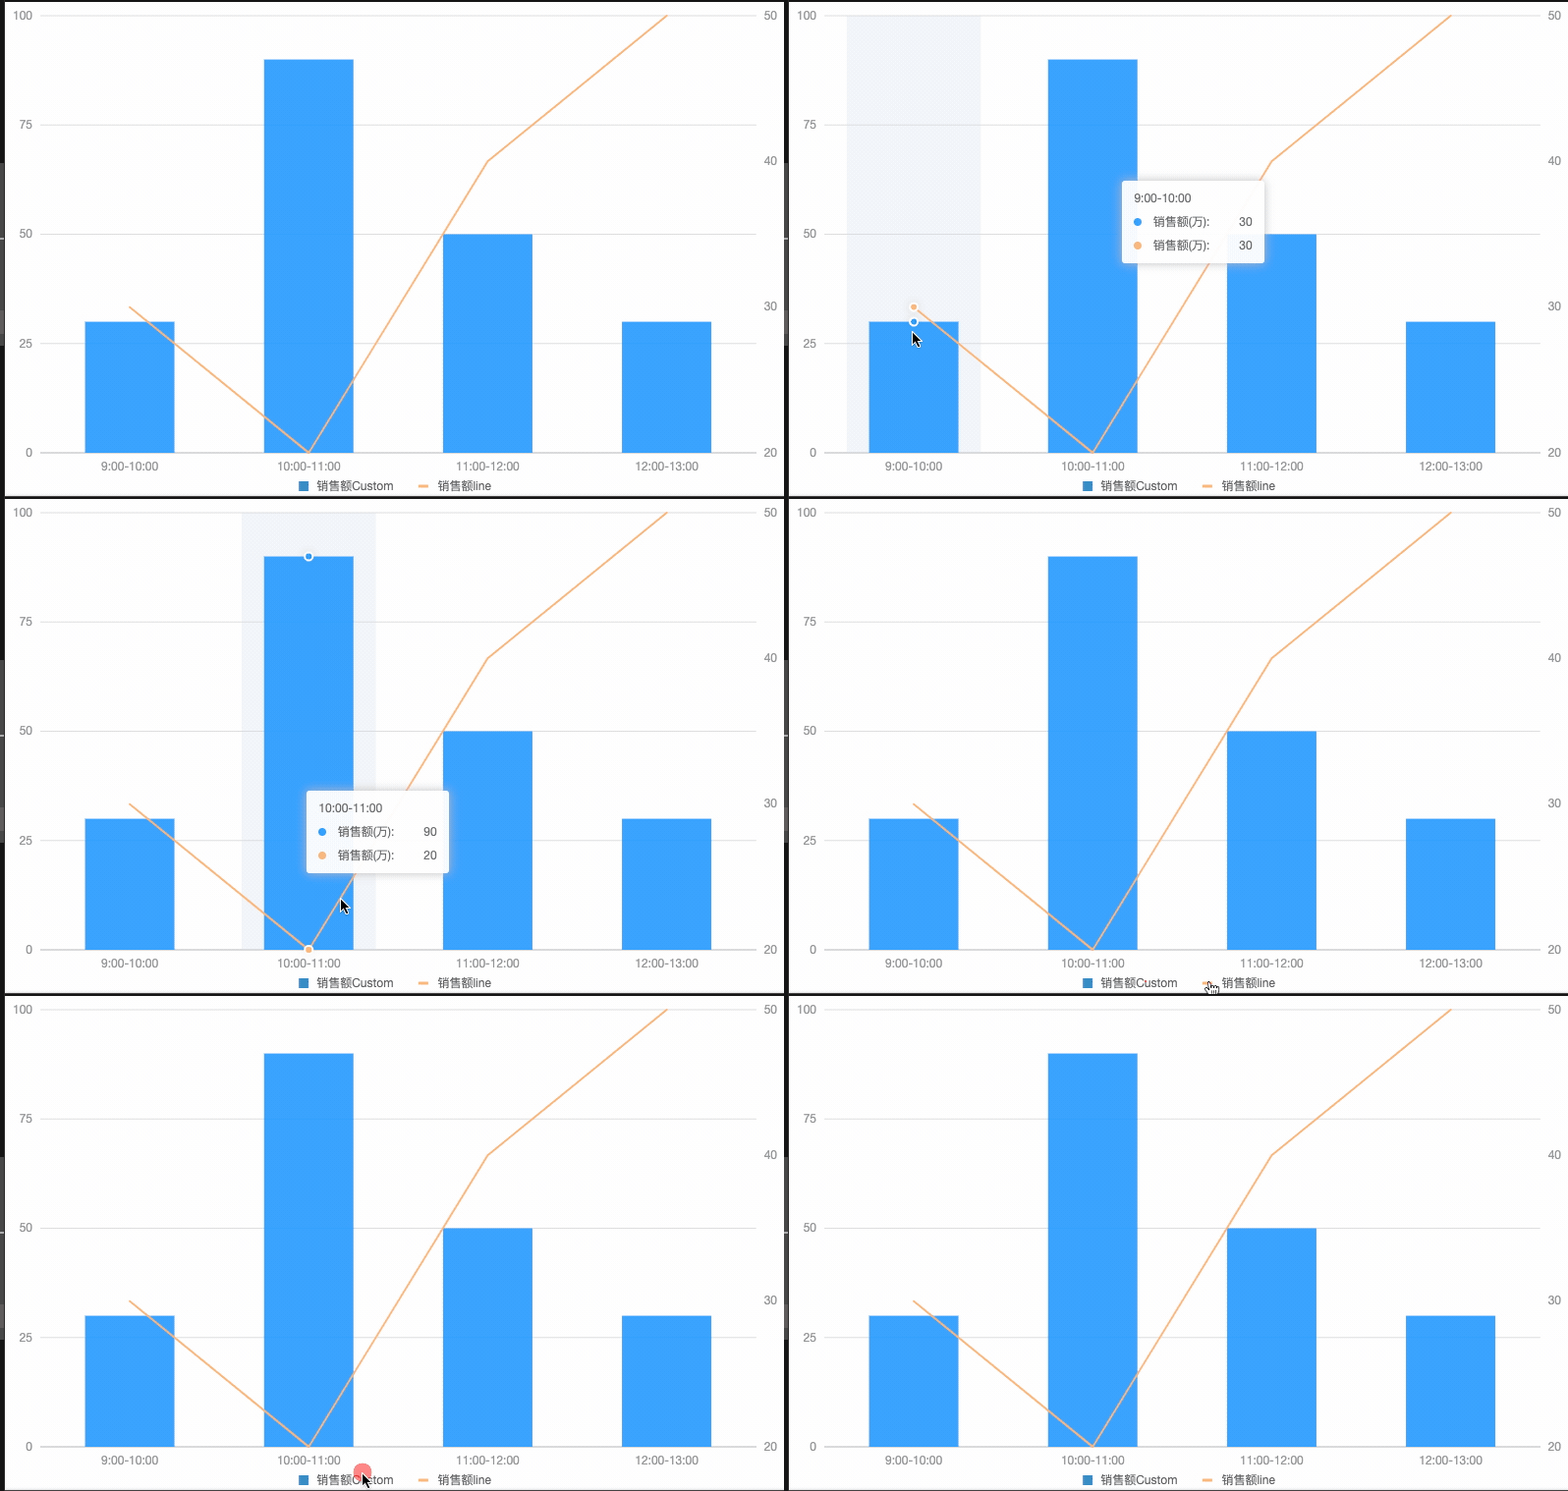
1
2
3
4
5
6
7
8
9
10
11
12
13
14
15
16
17
18
19
20
21
22
23
24
25
26
27
28
29
30
31
32
33
34
35
36
37
38
39
40
41
42
43
44
45
46
47
48
49
50
51
52
53
54
55
56
57
58
59
60
61
62
63
64
65
66
67
68
69
70
71
72
73
74
75
76
77
78
79
80
81
82
83
84
85
86
87
88
89
90
91
92
93
94
95
96
97
98
99
100
101
102
103
104
105
106
107
108
109
110
111
112
113
114
115
116
117
118
119
120
121
122
123
124
125
126
| import { Chart } from '@antv/g2';
const originData = [
{
time: '9:00-10:00',
value: 30,
value2: 30,
},
{
time: '10:00-11:00',
value: 90,
value2: 20,
},
{
time: '11:00-12:00',
value: 50,
value2: 40,
},
{
time: '12:00-13:00',
value: 30,
value2: 50,
},
];
const data1 = [];
const data2 = [];
originData.forEach((item) => {
const { time, value, value2 } = item;
data1.push({ time, value, type: '销售额Custom' });
data2.push({ time, value2, type2: '销售额Line' });
});
const data = [...data1, ...data2];
const chart = new Chart({
container: 'container',
autoFit: true,
height: 500,
padding: 'auto',
});
chart.data(data);
chart.scale('value', {
alias: '销售额(万)',
nice: true,
});
chart.scale('value2', {
alias: '销售额(万)',
nice: true,
});
chart.axis('time', {
tickLine: null,
});
chart.axis('value2', {
grid: null,
});
chart.tooltip({
showMarkers: false,
});
chart.legend({
custom: true,
items: [
{
value: 'value',
name: '销售额Custom',
marker: { symbol: 'square', style: { fill: '#3182bd', r: 5 } },
},
{
value: 'value2',
name: '销售额line',
marker: {
symbol: 'hyphen',
style: { stroke: '#fdae6b', r: 5, lineWidth: 3 },
},
},
],
});
chart.on('legend-item:click', (ev) => {
const target = ev.target;
const delegateObject = target.get('delegateObject');
const item = delegateObject.item;
console.log('item', item);
let showLegend = [];
for (let i = 0; i < delegateObject.legend.get('items').length; i++) {
if (!delegateObject.legend.get('items')[i].unchecked) {
showLegend.push(delegateObject.legend.get('items')[i].value);
}
}
showLegend = [...showLegend];
console.log('showLegend', showLegend);
console.log('filed item.value', item.value);
chart.filter(item.value, (value) => {
if (value === undefined) {
return true;
} else {
return showLegend.includes(item.value);
}
});
chart.render(true);
});
chart.interaction('active-region');
chart.interval().position('time*value').color('type', '#2194ff');
chart.line().position('time*value2').color('type2', '#fdae6b');
chart.tooltip({
shared: true,
});
chart.render();
|


